Get the YouTube keyword tool
If you don’t already have ChannelStudio’s free YouTube keyword tool yet, go get that before continuing.
You’ll be prompted to sign up & add the extension to your browser, at which point you’ll be ready to get started doing YouTube keyword research.
How the keyword research tool works
ChannelStudio’s keyword research tool combines data from YouTube & Google Trends with our global keyword database to provide you with detailed & accurate metrics on YouTube keywords, including: search volume, competition, & growth trend.
When you research a keyword in ChannelStudio, we’ll open up two tabs:
- A YouTube tab that will display the top results for that keyword.
- A Google Trends tab that will fetch the trend data.
(This tab will open in a minimized window to stay hidden & out of your way)
Research a keyword
There are a few ways to research a keyword with ChannelStudio:
youtube.com search bar button
- Open youtube.com .
- Enter the keyword you want to research in the YouTube search bar.
- Click the button on the right side of the search bar.
channelstud.io
- Open channelstud.io .
- Enter the keyword you want to research.
- Press return (Mac) / enter (Windows), or click the Search button.
Browser extension button
- Pin the extension to your browser bar if you haven’t already done so.
- Click the ChannelStudio extension icon in your browser toolbar.
- Enter the keyword you want to research.
- Press return (Mac) or enter (Windows).
Keyword stats
Search volume
The number of searches per month on YouTube for the keyword
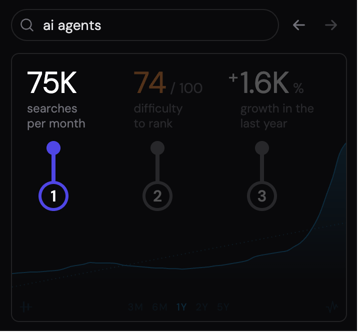
The search volume metric shows you the estimated number of times that the keyword was searched on YouTube in the most recent month (global monthly search volume). You can see what the monthly search volume was at any point in the past 5 years by hovering over that point in the trend chart.
You can optionally switch the metric to display the average monthly searches over the specified period instead by clicking the dots that appear directly beneath the search volume metric.
Keywords with high search volume typically also very difficult to rank for, so if your channel is still relatively small, don’t be tempted to target the keywords with the highest search volume.
Instead, we recommend chosing long-tail keywords that still have decent search volume, but less competition — then working your way up to higher search volume keywords over time. Once your videos are consistently ranking for the keywords you’re targeting, you’ll know you’re ready to graduate to chasing the bigger prizes.
Like all YouTube keyword tools, ChannelStudio’s search volume are estimates. However, unlike other tools, our estimates are based on the source-of-truth data that provided about YouTube via Google Trends.
In fact, when comparing the relative search volumes reported by leading YouTube keyword tools against Google Trend’s known accurate data, ChannelStudio’s data was found to be 99% accurate, while the next best competitor only had an accuracy of 56%! If you’re wondering how ChannelStudio’s data is so accurate, or wondering how exactly accuracy was calculated, you can read a detailed explanation here .
Note that we use shorthand to represent large numbers:
Displayed as | Equivalent to | |
|---|---|---|
| 100 | 100 | |
| 1k | 1,000 | |
| 100k | 100,000 | |
| 1M | 1,000,000 |
Difficulty level
The difficulty to rank for the keyword
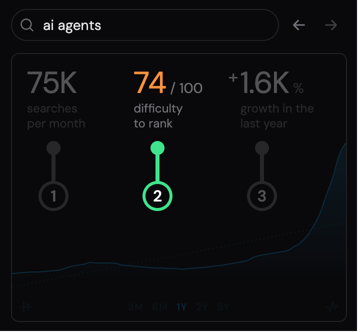
The difficulty level tells you how challenging it’s going to be to rank for a given keyword (some other keyword tools refer to this as “competition”).
ChannelStudio’s difficulty algorithm analyzes a variety of factors for a given keyword when calculating the difficulty level, but it’s mainly a reflection of the “view velocity” (views per hour) a video would need to acheive in order to rank among the top results.
It can be helpful to think of the difficulty level as similar to the concept of “weight class” in boxing — where boxers only fight other boxers in their same weight class. If a featherweight fighter were to go up against a heavyweight fighter, it wouldn’t end well. The same goes for little channels competing for the same keywords as heavyweight channels (think, MrBeast, etc.) — you won’t stand a chance.
Difficulty score | Difficulty | Channel “weight class” | |
|---|---|---|---|
| 0 - 24 | Easy | Featherweight | |
| 25 - 49 | Moderate | Lightweight | |
| 50 - 74 | Challenging | Middleweight | |
| 75 - 100 | Hard | Heavyweight |
If you’re just starting out, we strongly encourage you to primarily stick to keywords in the easy difficulty zone. Once your videos are consistently ranking for the easy keywords they’re targeting, you can graduate to targeting some higher-volume moderate keywords. And so on, until your channel is big enough to rank for even the most difficult keywords!
It can be frustrating to be unable to rank for the most popular terms early on, but if you approach the challenge with the right mindset, it can actually be incredibly fun and gratifying — like leveling up in a video game as your channel grows!
Growth trend
The change in the keyword’s search volume over time
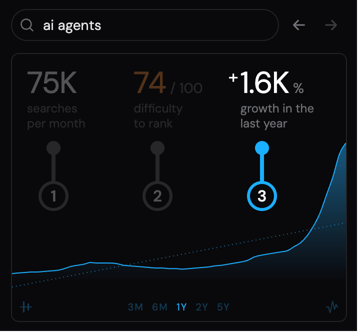
The trend metric shows the percentage change in the monthly search volume over the time period selected in the trend chart.
For example, if you had selected 1 year as the time period, and a keyword had doubled during the last year, the trend metric would be:
%
growth in the last year
If instead the keyword’s monthly search volume had grown 11x during the last year:
%
growth in the last year
If a keyword’s monthly search volume is half of what it was last year:
%
decline in the last year
ChannelStudio’s trend data comes straight from the publicly-available data about YouTube searches from Google Trends . That means it’s as accurate as it gets!
Although finding keywords that are generally growing is a good idea — especially when it comes to initially picking the niche your YouTube channel will target — it’s also important that you don’t over-index on that one factor and potentially miss out on some great keywords as a result.
To put it another way, let’s imagine we have two keywords of equal difficulty. If one keyword had 1,000 searches per month but was shrinking, and the other had 100 searches per month but was growing, choosing the one with the higher search volume is likely the right call.
However, keywords that have experienced rapid growth can represent great opportunties since they often have much lower difficulty than other keywords of a similar size, so it’s certainly worth researching any newly-hot terms or phrases in your space that you come across.
Trend chart

The chart that appears below the key metrics shows how the keyword’s monthly search volume has changed during the selected time period. You can review up to the last 5 years of historical trend data for keywords.
Time period
To change the time period, click the buttons that appear below the chart:
Button | Time period | Keyboard shortcut | |
|---|---|---|---|
| 3M | 3 months | 3 | |
| 6M | 6 months | 6 | |
| 1Y | 1 year (12 months) | 1 | |
| 2Y | 2 years | 2 | |
| 5Y | 5 years | 5 |
For example, if you clicked the 6M button, the chart will display how the search volume has changed over the previous 6 months.
Different time periods are useful for different things. The 3 month and 6 month charts can be helpful when there has been a significant change in search volume recently. While the 5 year chart can give you a better sense of the overall direction a keyword is heading in the long term.
The 1 year chart strikes a nice balance between the long term and the short term, but it can obscure seasonal trends that would be obvious on the 2 or 5 year charts (e.g. Searches for “pool games” are growing rapidly! Oh wait… they do that every summer).
Inspect historical data
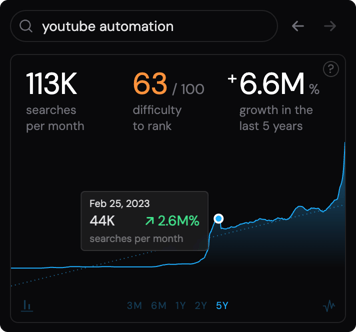
You can hover over any point in the chart to see what the monthly search volume was on that date. The trend metric displayed within the popup tells you how much the search volume has grown or declined since the first data point displayed in the chart.
Absolute vs relative chart
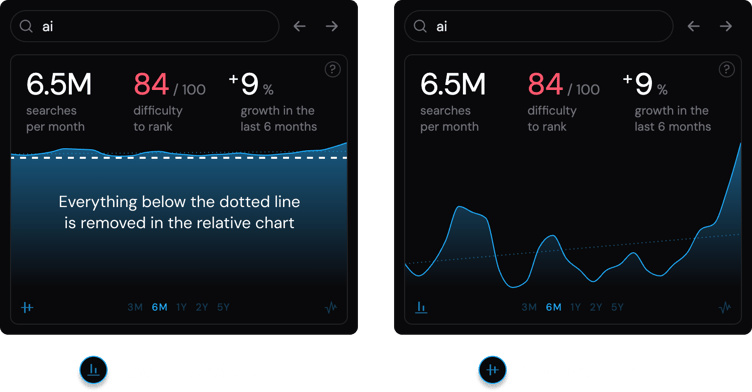
Absolute chart
Displays the data on the chart with a zero baseline. Meaning, the chart is a direct reflection of how the total search volume has changed.
A 10% change in search volume will appear nearly flat in this view.
Relative chart
Displays the data on the chart with a baseline defined by the lowest point on the chart. Meaning, it’s as if you’ve lopped off the bottom portion of the absolute chart to be able to zoom in on the portion that’s changed (see above).
A 10% change in search volume will appear to be a substantial change.
Raw vs smooth data
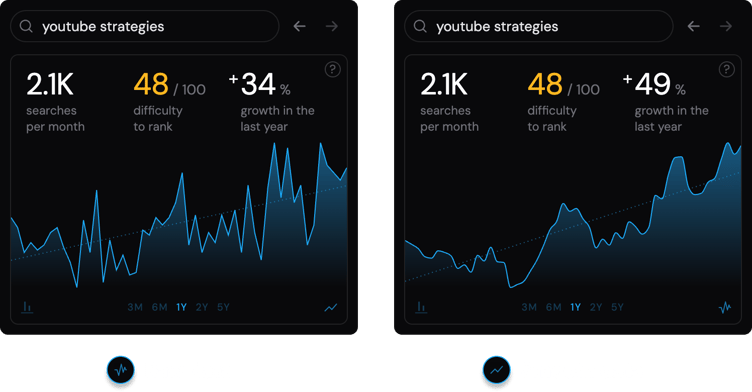
Raw data
Displays the data on the chart with no adjustments or alterations. This view can be helpful when you care about changes in the trends at a detailed level (precise week-to-week changes).
This chart will appear spiky like rocky mountains, making it harder to interpret at a glance — but it’s precise.
Smooth data
Reduces “noise” in the trendline using a rolling average (meaning, data points are averaged with their neighbors). This view can is helpful for understanding the keyword’s general trend over time. Although it’s not as precise, it usually closely reflects the underlying trend.
This chart appears smooth like rolling hills, making it easier to interpret the overall trend — but can misrepresent big changes between weeks.
When you’re doing general keyword research, we recommend using the 1 or 2 year time periods, with an absolute chart & smooth data. Then use the other time periods & views to dig deeper as needed.
Long-tail keywords
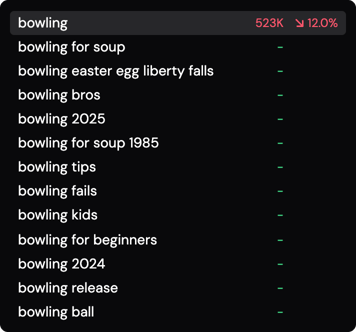
The list of keywords that you see below the keyword stats card are sourced from the autocomplete suggestions from YouTube. These keywords are longer, more-specific phrases that include the main keyword — known as “long-tail” keywords. Long-tail keywords typically have a lower difficulty level.
The role of long-tail keywords in YouTube SEO
If you want to rank for a high-traffic keyword that’s currently out of reach for your channel, targeting the related long-tail keywords first can help you build up the momentum you need to go after the big prize.
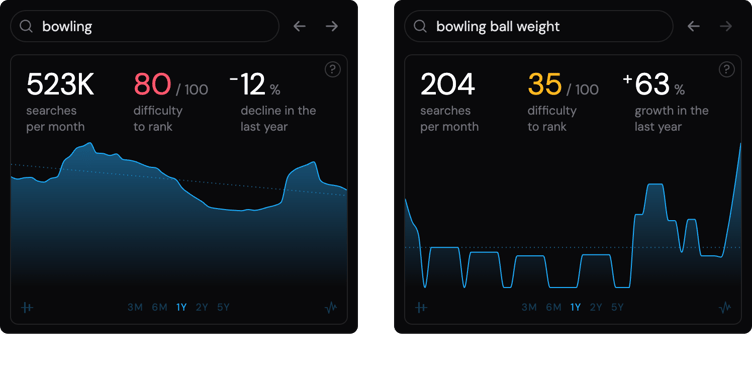
When a person watches a video on YouTube, and the same channel posts a similar video, the algorithm often recommend it in the person’s feed. This means that each time you post a video targeting a long-tail keyword (“bowling ball weight”), you are accumulating an audience that will help your future videos perform better once you’re ready to go after the more-competitive root keyword (“bowling”).
The keywords that appear in the list are typically the long-tail keywords with the highest number of searches per day recently. Meaning, they either have consistently high search volume (e.g. “music videos” for the main keyword “music”), or have had lower search volume historically, but have experienced a spike in interest recently (e.g. “new music videos 2025” for “music”).
Drill down
To drill down into a keyword you find in the list, click the underlined link that appears on the keyword when hovering over the row. We’ll then display the long-tail keywords for that more-specific keyword (“bowling” → “bowling ball” → “bowling ball weight”).
Fetch data
If instead you simply want to know the stats for a keyword in the list without drilling down, click the query_stats that appears on the right side of the row. The selected keyword’s data will appear on the keyword stats card & the keyword’s row, but the list of long-tail keywords won’t change.